

Introduction
So let’s say you have a SharePoint list with some summary data that you want to present to your users in a more understandable and visually attractive way.
If your data represent portions of a greater total like company sales then you can use a Pie Chart!
Scenario
The company Tico Apparels has stores in several of the provinces of Costa Rica. They have the total sales for each of their locations and want to view how much of their total sails each location represents. So they ask you to provide a pie chart of the sales data. They have the data saved in an SharePoint list (if they didn’t you could export it there, but that wont be covered here).
Tutorial Requirements
To follow the tutorial you will need:
- A SharePoint Developer site
- A SharePoint list that has the following fields: Title, Color, Value (value has to be of type Number, the other are “Single line of text”)
- Napa Tools installed or Visual Studio (in the tutorial I’ll use Napa Tools)
- The open source Chart.js JavaScript library. Download here
Step One
Fill the list from with the following demo data:

Data for the SharePoint List
Step Two
Open Napa Tools: go to Site Content and click on “Napa” Office 365 Development Tools then click on Add New Project the tile with a plus sing. Select App for SharePoint and give it a name. Then click Create
You will get a SharePoint-Hosted application on the Napa Tools IDE that looks like:

Initial App Template provided by Napa Tools
There are 3 sections. The “Tool Bar”, the “Explorer” for your files and the “Code View Window”.
Step Four
Upload the Chart.js JavaScript file to your project. In the Explorer window right click the Scripts folder and select “Upload Files”, browse for the Chart.js file and upload it.
Step Five
Go to the Default.aspx page under the Pages folder in the Explorer and add a reference to the Chart.js file under the App.js reference like so:
<!-- Add your JavaScript to the following file --><script src="../Scripts/Chart.js" type="text/javascript"></script><script src="../Scripts/App.js" type="text/javascript"></script>
Step Six
Replace the Application title by going to the PlaceHolderPageTitleInTitleArea and changing “Page Title” to the corresponding name for your app (what ever you like). I named it “Pie Chart”.
Step Seven
The pie chart renders on a canvas tag. So replace the content of the tag with id PlaceHolderMain with the following:
<canvas id="pie" height="300" width="400"></canvas>
Step Eight
Delete all the pre-existing code except for the $(document).ready function. This includes the getUserName, the onGetUserNameSuccess and the onGetUserNameFail functions. Now the fun part begins! Let’s start coding. The first thing you need to do is the code to connect to the SharePoint site and get the data from the list. So add the following code below inside the anonymous function, below the line (function () {
var hostweburl;
var appweburl;
Those are the variables that will contain the service objects need to connect to SharePoint
Then inside the the function of $(document).ready add the following code:
/* get the url of the web application that hosts the SharePoint app
we're working on*/
hostweburl = decodeURIComponent(getQueryStringParameter("SPHostUrl"));
appweburl = decodeURIComponent(getQueryStringParameter("SPAppWebUrl"));

// resources are in URLs in the form:
// web_url/_layouts/15/resource, so we set the root url where
// all the scripts are located
var scriptbase = hostweburl + "/_layouts/15/";

// Load the js files need from SharePoint and continue to the successHandler
$.getScript(scriptbase + "SP.RequestExecutor.js", execCrossDomainRequest);
You’re probably thinking “that looks like boiler plate code” and you are right. I would suggest creating a separate JavaScript module to encapsulate all the previous code (I might right a blog on how to do it in the future) but bare with me for the moment.
Step Nine
Now we will code the function that extracts the list data for us and then send it to another function that will feed that data to the chart.js library so that it creates the pie chart in the canvas element of our we added earlier to our page:
function execCrossDomainRequest(){
    // executor: The RequestExecutor object we use it to get list data
        // We create it by providing the SharePoint site url
        var executor = new SP.RequestExecutor(appweburl);

        // Issue the call against the app web.
        // To get the title using REST we can hit the endpoint:
        //  appweburl/_api/web/lists/getbytitle('listname')/items
        // The response formats the data in the JSON format.
        // The functions successHandler and errorHandler attend the
        // success and error events respectively.
        executor.executeAsync(
            {
              url: appweburl + "/_api/SP.AppContextSite(@target)/web/lists/getByTitle('PieData')/items?$select=Title,Color,Value&@target='" + hostweburl + "'",
              method: "GET",
              headers: { "Accept": "application/json; odata=verbose" },
              success: function (data, textStatus, xhr){
          var json = JSON.parse(data.body);
          var pieData = convertToPieData(json.d.results);
          createPieChart(pieData, "pie");
        },
              error: errorHandler
            }
        );
  }
See the comments in the previous code for the explanation. In short we are using the SharePoint provided Rest API to get data from the “PieData” list (replace it with the name of your list) in the form of a JSON object. The line var json = JSON.parse(data.body) transforms the response (which is a regular expression) to JSON format. Then we ask the convertToPieData function to copy the JSON data into an array of objects with the specific structure required by the Chart.js library to generate the pie chart.
Step Ten
Now let’s code the function that changes the JSON returned by SharePoint to the JSON object that will be used to generate the chart. Add the following function:
function convertToPieData(json){
  var arr = [];
  $.each(json, function(i, element){
    arr.push({label:element.Title, color:element.Color, value:element.Value})
  });
  return arr;
}
The previous code used the jQuery library to iterate through the array of json objects and pushes its data to a new array that which contains the names and structure need to create the pie chart with the Chart.js library.
Step Eleven
Add the function that generates the chart itself:
function createPieChart(data, id){
  //alert(results);
  new Chart(document.getElementById(id).getContext("2d")).Pie(data);
}
You’re probably thinking that we wrote a whole bunch of code just to get the data and format it and that actually creating chart was the easiest task of all… You know what… You’re right! And that’s precisely why using libraries like backbone.js, angular.js and react.js can help you be more productive by creating services and components to help reuse your code. That is to say you can write the boiler plate once and then re-use it several times. I will show you how to do this in later blogs.
Step Twelve
There is just two more functions need for this code to work. They both are boiler plate code and I don’t want to bore you with since they are not of particular interest so just copy past them in your code.
function errorHandler(data, errorCode, errorMessage) {
  alert("Could not complete cross-domain call: " + errorMessage);
}

function getQueryStringParameter(paramToRetrieve) {
    var params = document.URL.split("?")[1].split("&");
    var strParams = "";
    for (var i = 0; i < params.length; i = i + 1) {
       var singleParam = params[i].split("=");
       if (singleParam[0] == paramToRetrieve)
          return singleParam[1];
    }
}
Almost done! Before we can test this app we need to define the permissions that it needs to access the list data in the SharePoint in which it will be deployed. We want to add the least amount of permissions possible. Since we are only accessing data from one list that’s all we’ll give it access to.
Step Thirteen
At the left, in the Napa Tool bar click on the icon that looks like a wrench. It’s the settings configuration for your app. Now click on “Permissions” in the “Properties” area. Set the values like so:
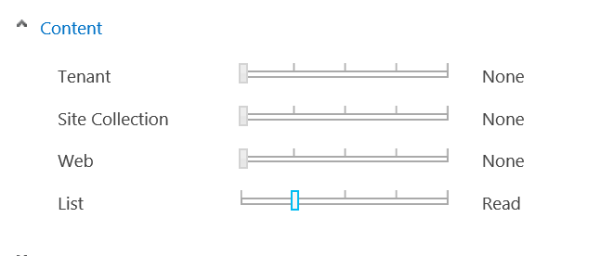
Gives the SharePoint app permissions to read a list
This will give your app the ability to read data from a given list which will be set when you install the app. Now click the “Apply” button at the bottom.
Step Fourteen
It’s time to execute the app! Go to the Tool Bar at the left and click the play like button, “Run Project”, then you will be prompt by SharePoint with a dropdown display to choose the list to which you want the app to have access. Choose the list with the data (the one created at the beginning of the tutorial). Then click the button labeled “Trust it”. The you should see the app load with the PieChart and your data. It should look something like this:

Pie Chart on SharePoint with Chart.js
I shared the project so you can see the entire code as it is in Napa here
I hope you were able to follow the tutorial successfully and learned something useful for your every day activities, if so please share the article in any SharePoint group or community that you know so that others can also learn. If you had any trouble please leave a comment and I’ll get back to you ASAP!
Best regards!